tbh, it looks like #Bitcoin is currently more closely tracking 2022 than any of the other previous four years. 65% drop from the yearly open puts price back in the $32k range. 😱
Not a prediction, just an observation. 🤷♀️ 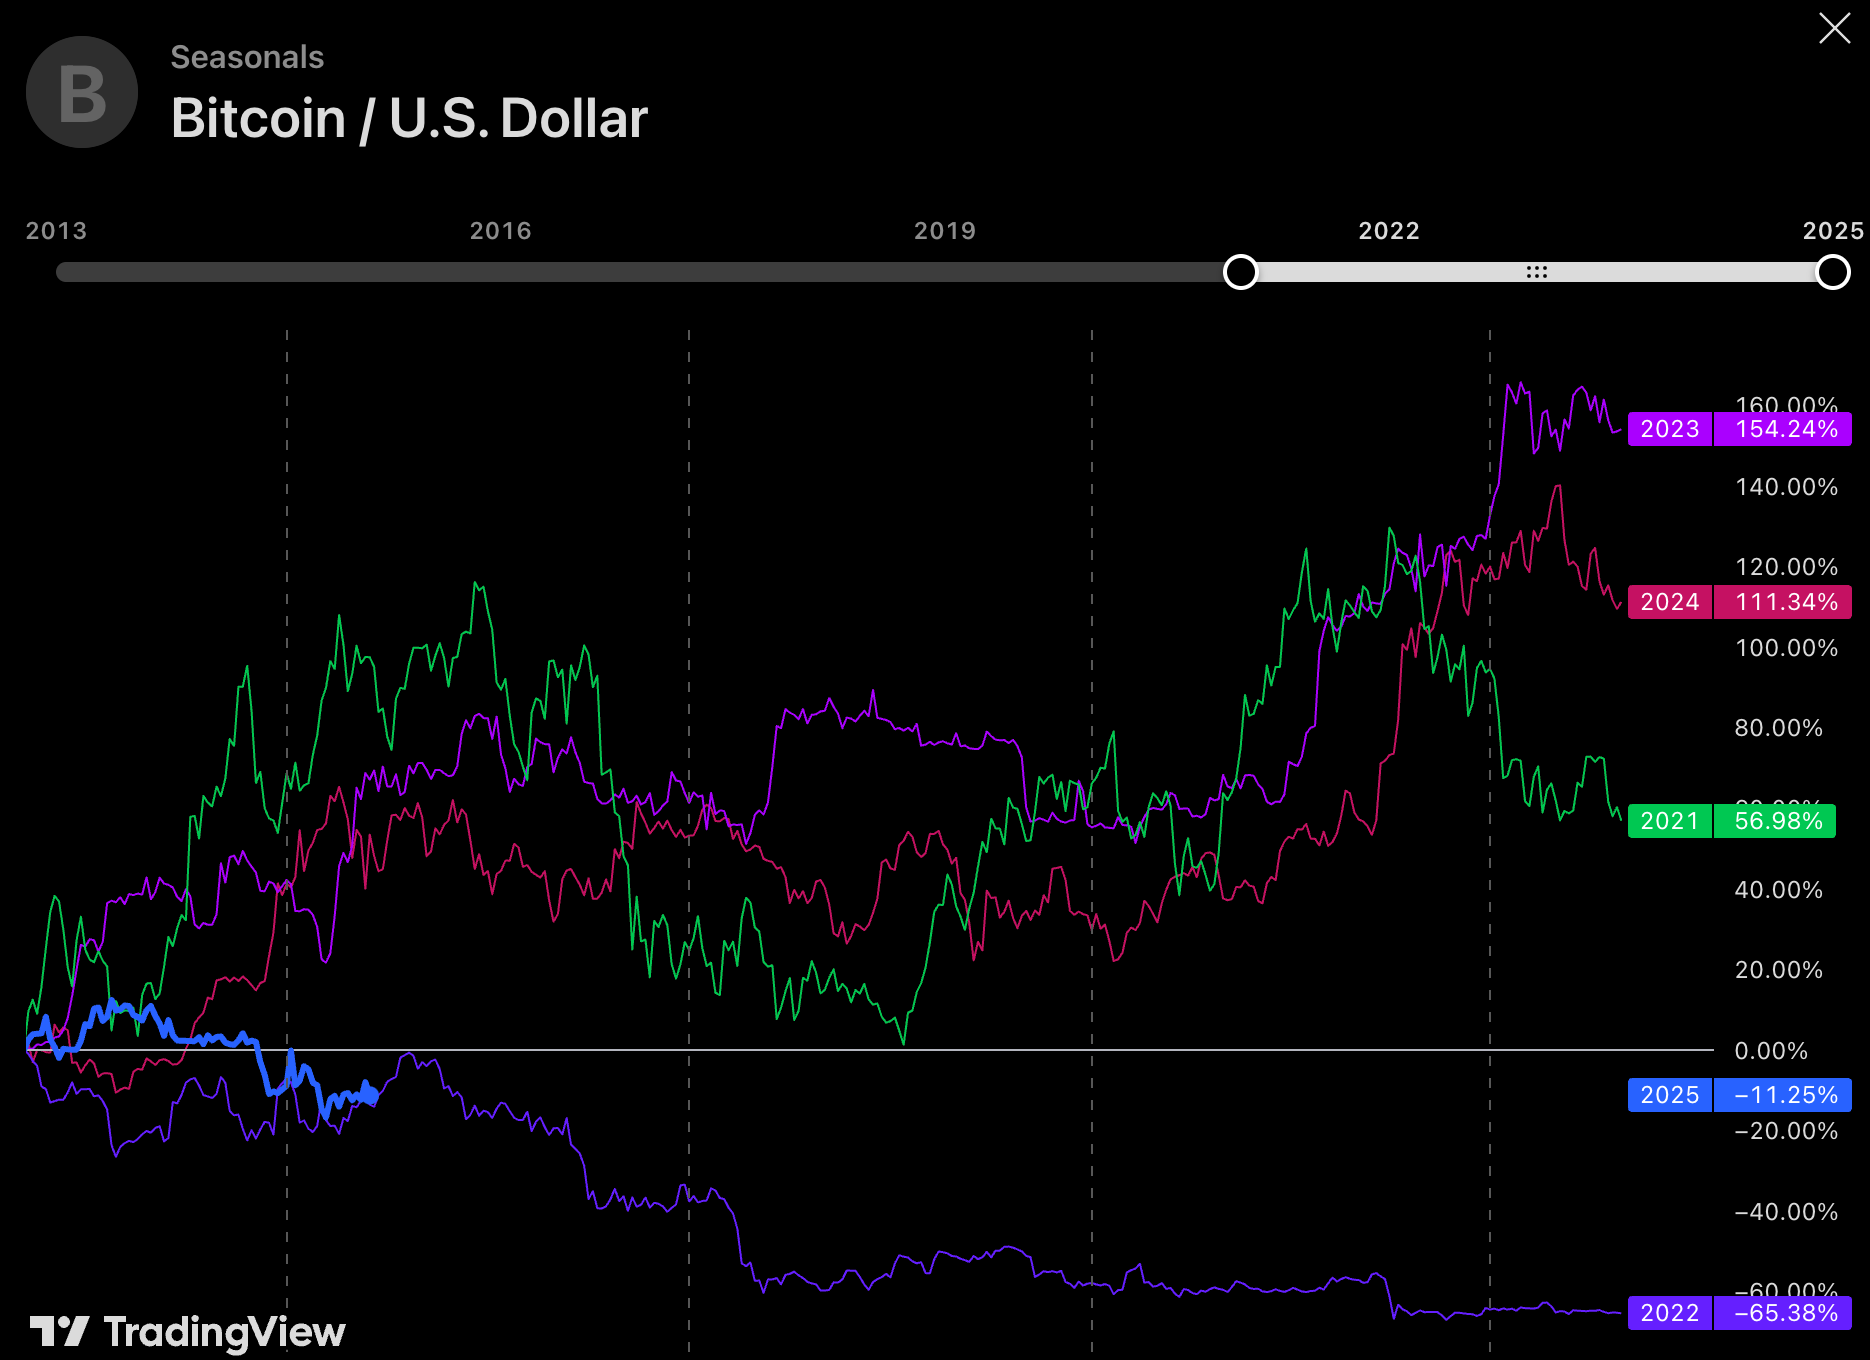
tbh, it looks like #Bitcoin is currently more closely tracking 2022 than any of the other previous four years. 65% drop from the yearly open puts price back in the $32k range. 😱
Not a prediction, just an observation. 🤷♀️
Love it
I love how everyone turn bearish suddenly, it's usually sign of an income huge bull move.
Def didn't say I was bearish 😆 I don't have a single $ left to my name. YOLO
"Observing" that we might head to 32k is kind of bearish. I completely lost trust in cycle comparison. According to what I predicted, we should be close to the cycle ATH about one year after halving. Then there should still have chances to go higher in the next 6 months but it's getting slimmer and slimmer with time passing.
But it turns out my prediction, like all other people predictions, were just complete bullshit. So wait and see, hope for the best.
Now the mood is like Lil Bubble says: "Hoping for the pump but expecting the dump".
Actions, not word. One can talk about price all you want, but it's irrelevant. All that matters is what's in your wallet (how many sats).
Also didn't say 'might head to 32k' at all. Personally don't believe for a second we will see those prices ever again.
But still, everyone saying we HAVE to go higher could be wrong, because currently we aren't tracking that type of trajectory at all. Doesn't mean it will or it won't happen though. Doesn't mean anything at all really. 🤙
I’ll take the cheap sats 🤞🏼
This is such a cool chart! Thanks for it!
Courtesy of TradingView 😉
It's interesting to play around with, they have data going back to 2013; fun to compare different years to each other.
I'm definitely going to set this up. This with respective global M2 liquidity and also a longer chart (more time, to see the bear cycles too) would be very cool.
Top notch stuff. Thanks again :)
Comparing Bitcoin price chart to global M2 is wild– the correlation (delayed by 10-12 weeks or so) is so close it’s crazy!
Spoiler alert: M2 has been going ⬆️