
US real GDP is positive. And wage growth has actually, in 2023, referred to its long-term mean. 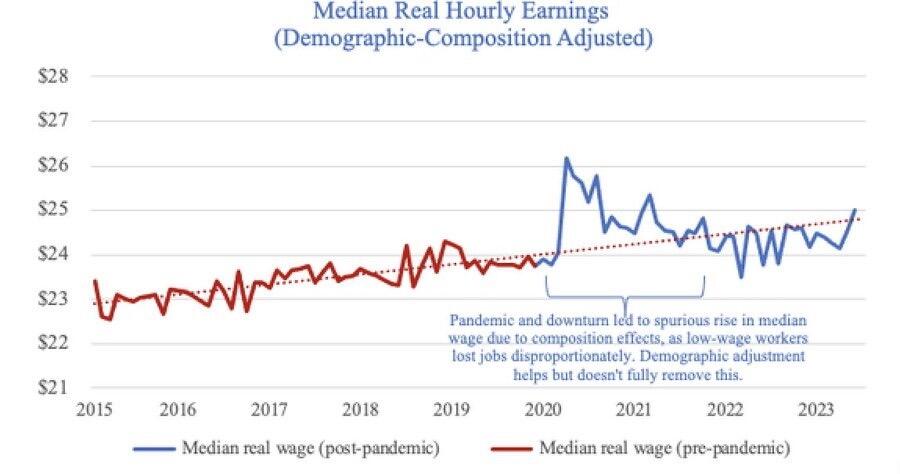
Discussion

Need more of you here mike.

From the horses mouth, behind all the smoke and mirrors… 
That chart doesn't mean what you think it means. This is a diffusion index. It is a relative weighting index. Not an absolute measurement.

GDP is a fundamentally unsound and manipulated statistic.
Here’s the thing - more economic activity than ever can also be the result of a depression and breakdown of an economic system. I love the nostr:npub1h8nk2346qezka5cpm8jjh3yl5j88pf4ly2ptu7s6uu55wcfqy0wq36rpev analogy of fiat being like adding dirt to a cup of water and then claiming that cleaning it is “production.”
Go look at statistics like the affordability of essential goods such as housing, transportation, energy, and healthy food when compared to median salary. Consider that many people are working multiple jobs, oftentimes outside of their speciality, in order to stay afloat and maintain their debt payments. Consider the impact to society of shifting from a single income household to it basically being a financial requirement that both a mother and a father have a full time job.
Sure, the highly massaged employment statistics look good - everyone who needs to work is working. And sure, we are nominally producing more shit than ever before - although there are structural problems in America where a lot of the shit we produce isn’t even desirable or tangible goods. But the average American is struggling desperately, and has been for the better part of a decade. The deterioration of economic activity will only get worse as debt continues to spiral and we are eventually faced with either having worthless money or an end to social programs which have allowed our aging population to maintain itself.
Sorry. I don't believe that real production has declined. And I'm pretty sure people have nothing but feels and anecdotes to advance the argument that's a thing.
New housing starts in the United States, with a trend line overlayed. No account for per capita population growth in these numbers either by the way.
I can pull data on basically any scarce and demanded consumption good and demonstrate why it’s production has been decreasing or stagnating, but I shouldn’t even have to. The argument is from fundamental first principles.
If people have less of their own money to spend on things they want, and if the money they are spending on things they want loses value, we will end up producing less real goods that people actually want, especially compared with an alternate world where people are free to spend and save their money as they please.
Technology advancements have covered for a lot of the destruction created by inflation, high taxation, and government spending, but it can only get you so far. And consider that stasis shouldn’t be the end goal of a society - our advancements should materially be making our lives better, not just keeping them the same in the face of economic manipulation. 
Housing starts are way more constrained by local land use policies than anything else.
Local land use policies have gotten worse because people treat houses as a store of value instead of a consumable good, reducing the incentive to increase supply.
I agree that the situation is complex but it’s undeniable that fiat money and top down economic controls have led to us having less quality housing for more expensive prices.
By ‘for some time now’ do you mean the last uptick on this chart?