Bitcoin vs global liquidity:

Bitcoin vs global liquidity:
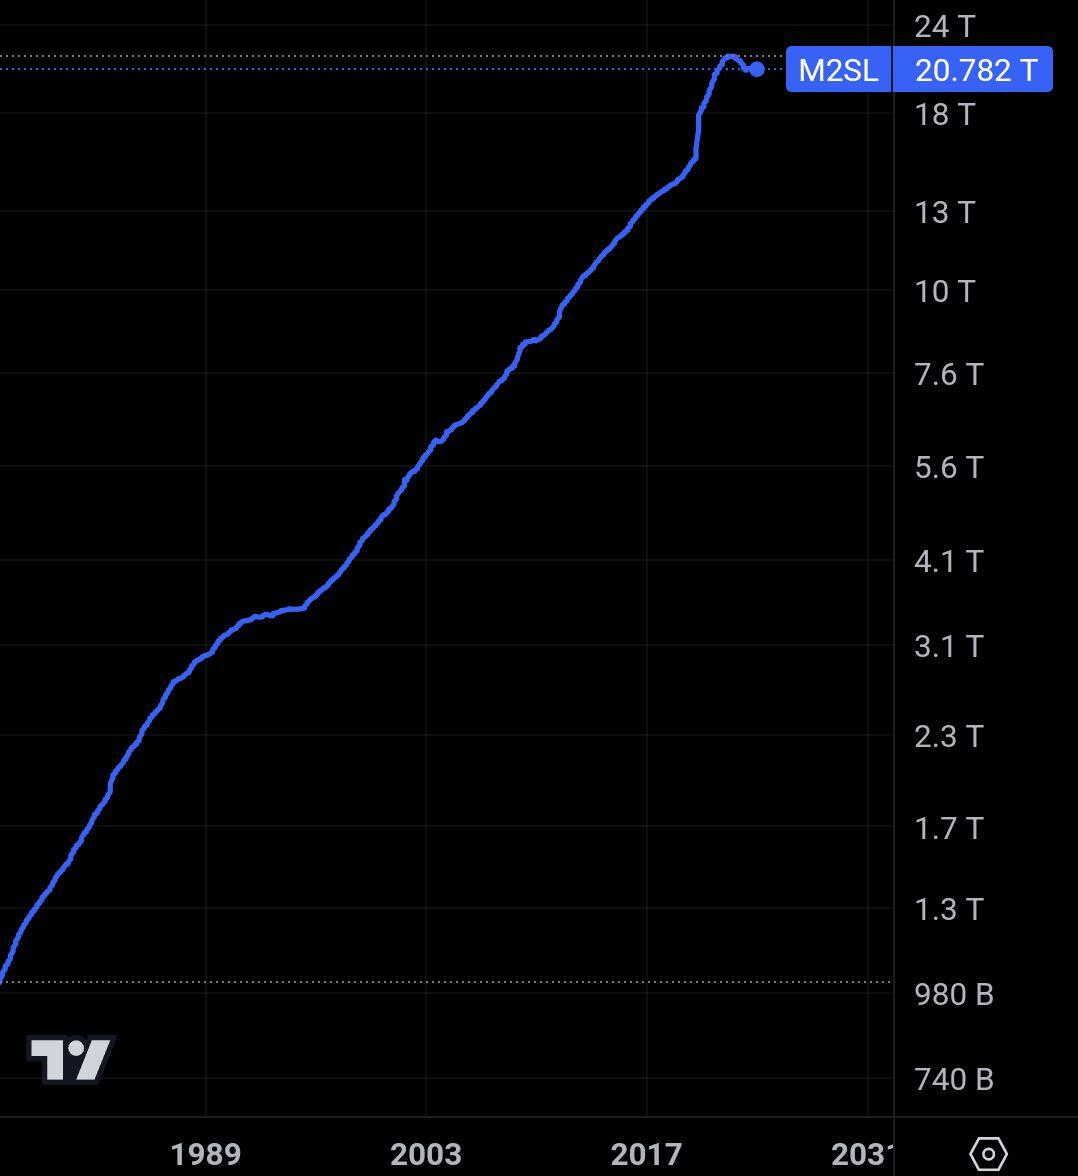
Second half of the v shape on M2 just being realized in Bitcoin price. Maybe #Bitcoin pauses while waiting for more global liquidity?
This is a typical bullshit graph (see https://www.callingbullshit.org/):
The y-axis is logarithmic to increase the appearance of a strong correlation.
Here‘s actually the source:
For a Bitcoiner you think a bit too much and ask too many questions.
😍
It aligns perfectly: Whenever it outpaces global liquidity growth, adoption must be occurring. It appears that there was significant adoption in 2020.
Now do pirates and climate change.
Interesting
Idk the terms, but it appears BTC may track global liquidity but in a more forceful way since BTC is log and M2 is not. Fine by me.
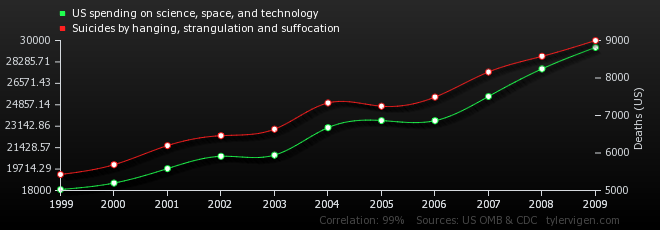
Michael Saylor's thesis includes the idea that M2 is the real measure of USD fiat inflation. I don't know if this idea is quantitatively proven, but on a gut-level it's more probable than the CPI metric. Nevertheless, beware of #spuriouscorrelation https://www.tylervigen.com/spurious-correlations
I fail to understand this one, despite seeing it in the newsletter every other week.
lhs is logarithmic
rhs is linear
Seems like a flawed comparison, but I don't really grok most of the macro stuff anyway
Bitcoin is on an exponential structural tech/adoption trend, but the cyclical direction of that trend is highly correlated with global liquidity.
Is that correlation more about sentiment than actual monetary value (as the bitcoin axis is exponential)? As there’s more liquidity, people become more comfortable with storing value in the network, perhaps?
Would be more useful if both were on the same scale (log) or standardized scores for a single y-axis
Correlation doesn't mean 1:1 linear relation.
An observation can be "everytime that A goes up, B follows" and vice versa - even if scales are completely different.
Correlation also doesn't mean causation. It's an observation that Lyn presents here.
Aren't you thinking a bit too much. Why not accept things the way they are it's the best for you.
Just sayin’
Why is M2 going up even with QT going on?
1) the chart says "global m2". There's actually other countries outside the US, each with their own policy.
2) US M2 is _almost alwys_ rising. The current QT is the tiny blip at the end of the curve.
You had a very thoughtful answer to this on Rebel Cap pro. Thanks. Would love to hear a full write up or focused interview with some other heavy hitters on conditions that might decouple BTC from liquidity. My thesis is a melt up to ATHs in all markets…then a massive puke like 08’…Then they print 10-20T…. Everything roars back…Which then triggers the fiat system awakening…Then we see risk adjusted portfolios piling into PMs, BTC, etc. Could take 2 to 10 years with a lot of economic pain and gubment fuckery to navigate along the way.
nostr:npub1pyp9fqq60689ppds9ec3vghsm7s6s4grfya0y342g2hs3a0y6t0segc0qq has a good chart on this also.
https://www.tradingview.com/chart/ugMD3RGy/
I would love to see this adjusted by some alpha geek charter according to what Dr Singh is throwing down with nostr:npub1uyz4w2w4rcphk0q5arzkutrecgscxwzajj4dkvh9mjyqjtxslm6qea8632 in this talk. Not sure how one would calc the hidden liquidity so to speak. He's probably the only who could.
I guess what dr dude is discussing might be qualified as “trapped liquidity” so maybe it doesn’t actually fit in the calc?
see any catalysts coming up that could drop global liquidity and bring some volatility?
Fed meeting next week. Will probably lower rates. They always lower rates with BTC halving.
nostr:note1cgqf52dlp9fdde9q68kvdzttpk9hucgpff8fncvnk989jnqe24gqzywn76
It looks like an inflationary hedging pattern.
From https://www.themarysue.com/spurious-correlations-engine/ :
 ?resize=640%2C223
That is the eye opener, right there. A big reason why its value increases. That and finite supply + adoption. The rest is mostly technical proofs of the robustness and future-proof.
Bitcoin is in some sense a mirror that reflects the raw truth of the current monetary regime.
Follow nostr:npub1a2cww4kn9wqte4ry70vyfwqyqvpswksna27rtxd8vty6c74era8sdcw83a for high signal
Join https://relay.orange-crush.com for based conversation.
nostr:note1cgqf52dlp9fdde9q68kvdzttpk9hucgpff8fncvnk989jnqe24gqzywn76
Interesting that bitcoin price is a log chart and the m2 supply is linear. Every $10 trillion om m2 is a 10x for bitcoin
nostr:note1cgqf52dlp9fdde9q68kvdzttpk9hucgpff8fncvnk989jnqe24gqzywn76