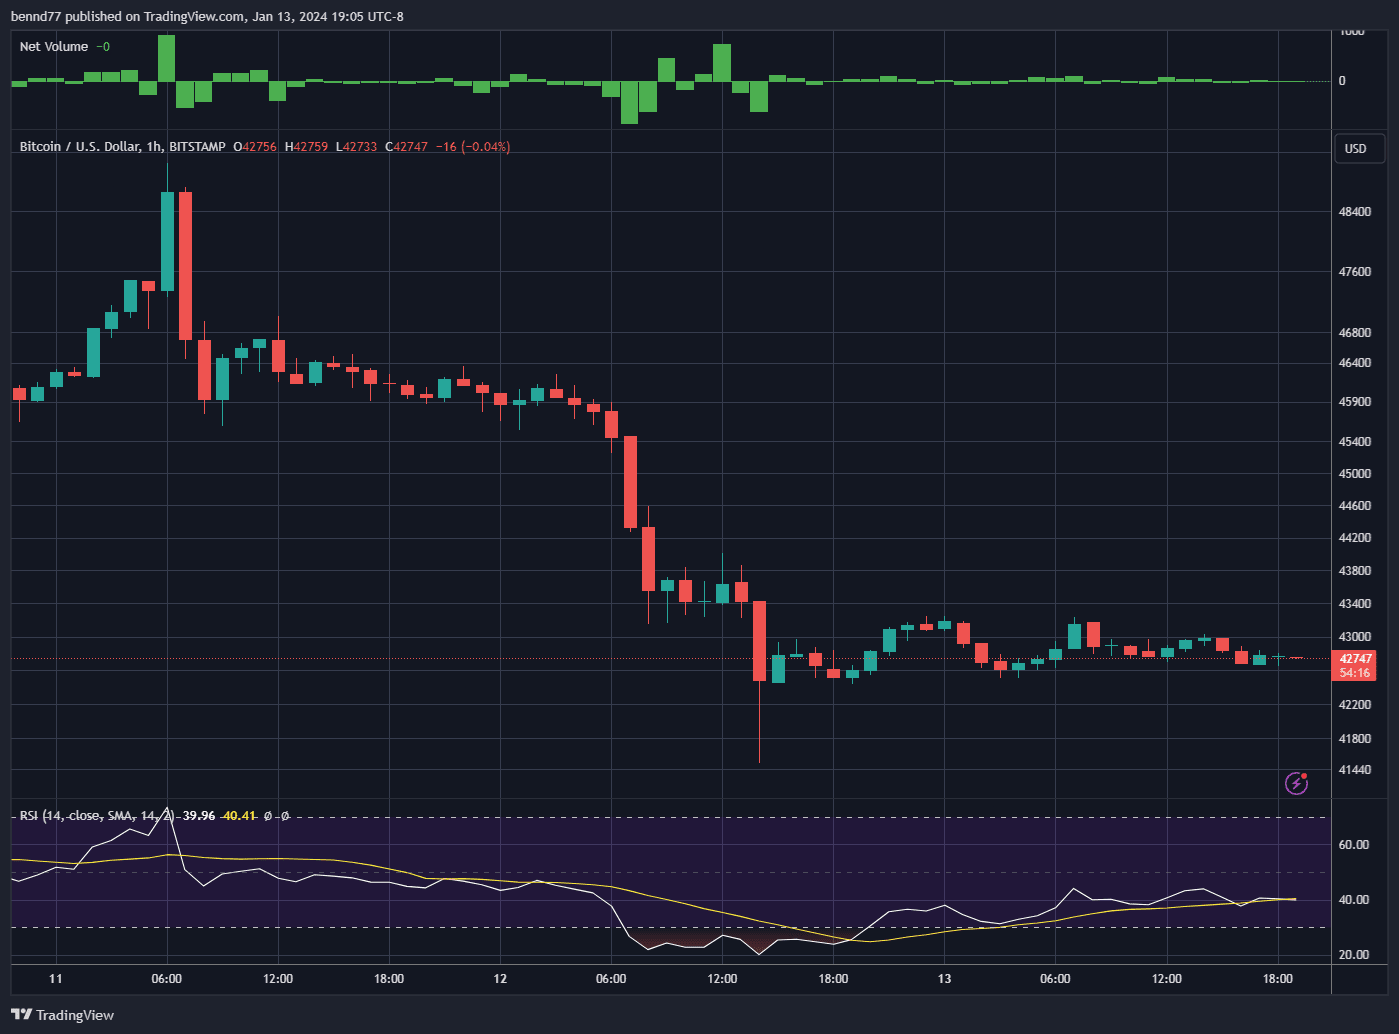
I have never seen sinusoidal behavior on a Bitcoin chart before.
I have never seen sinusoidal behavior on a Bitcoin chart before.
get ready for new things which never happened in 15years history
Me neither.. maybe if we drew some lines it’d tell us what is happening next?
I was thinking the same thing!
And now I can’t look away waiting for what’s going to happen in the next couple of hours. 🤣
What is sinusoidal behavior?
Like sin() cos()
Could you elaborate further? I’m highly regarded.
 #m=image%2Fjpeg&dim=1080x416&blurhash=Q6SidJM%7BX5M%7BkSM%7Bbut7kCx%5BVYIWgNt6R*t6t7WU%7EqW%3Bj%40V%40NMR-rqaenh&x=7661f700bd9467c4a85f5265848208855eca2cd771ffe59ca37093df9bf67472
it's like what happens with a ball on a spring where restoring force is proportional to distance from neutral position. ball repeatedly overshoots neutral position as it goes back and forth. interesting thing is that maximum velocity is reached as ball wooshes past neutral position where restoring force is zero, and minimum velocity (zero) is where restoring force is maximum at extremes where ball stops and turns around. damping is due to frictional forces. lots of similar examples in nature: basically anywhere you have "springs" or "waves" you will get sinusoidal motion. "spring" in case of btc chart could be some trader or bot (e.g., grid bot) that increases size of bet that price will revert to mean ("restoring force") with increasing distance from some moving average ("neutral position"). but if so, i expect that sooner or later they will get rekt, like the Nobel Prize winners who made a killing for about 6 months before almost crashing the Western financial system in 1999 (i.e., check out story of hedge fund called LTCM = Long Term Capital Management).
Use this online calculator to Enter sin(x) or cos(x)
 #m=image%2Fjpeg&dim=1125x686&blurhash=iAAmuT%7EV0f57%5D%2B%7EBobE2M%7B56WE%5ERxu9tD%25t7%252ayD%25SOn4ofX8V%40bcRjae%3FcxGI%3At6-VxuRkRkt7DiIVs%3As.bwNGIofks%3A&x=1c4d46383cd4628d37c84f4fe64cd7278e449fb9d2ebba1a58ba6e9b40b6f781
But shouldn't it be 3G 1R?
I don’t typically look at charts but the thing that popped into my mind is perhaps dueling high frequency trading algorithms, with the new ETFs or some other source? All The ETFs are supposed to be passive right? Maybe still passive but they are using the high frequency tech on their buys and sells. Or just a policy they have set to fill their buys and sells over time to not over flow the market in one direction or another + And the timing has randomly synced of this period like when you notice your turn signal is synced to the car in front of you.?
I think you’re right. Some function has begun work. That shit is not organic.
I have never seen the USD/BTC hover around a value like it has the past 4-5 days and no one seems to be talking about it.
I think you are saying the USD to BTC ratio volatility has decreased? May need more time to actually prove that or measure it, I think it would make sense for BTC volatility to decrease with ETFs. More market participants, and a mechanism for a wider audience for shorting. ETF managers as a matter of policy probably have to buy or “unload responsibly” over time rather than making big waves in the market if they can help it. Fun to watch.