Been playing around with some Python..

Still a bona fide noob, so take it easy.

We all understand that BTC is "going up forever" compared to fiat, but will it actually increase in purchasing power forever?

I believe so, but would like to actually track and analyze it.

Since the Consumer Price Index (CPI) is the most widely used measure of inflation, I figured it would be interesting to use this data in conjunction with Bitcoin price data to create a new metric, which I'm calling the Bitcoiner Price Index (BPI). That is, CPI is the measure of prices paid by US consumers, and BPI is the measure of relative prices paid by Bitcoiners.

I understand CPI is far from ideal or complete data, but it's what I have access to and what the mainstream economists (🤢) seem to use, so I'll use it as well, at least as a start.

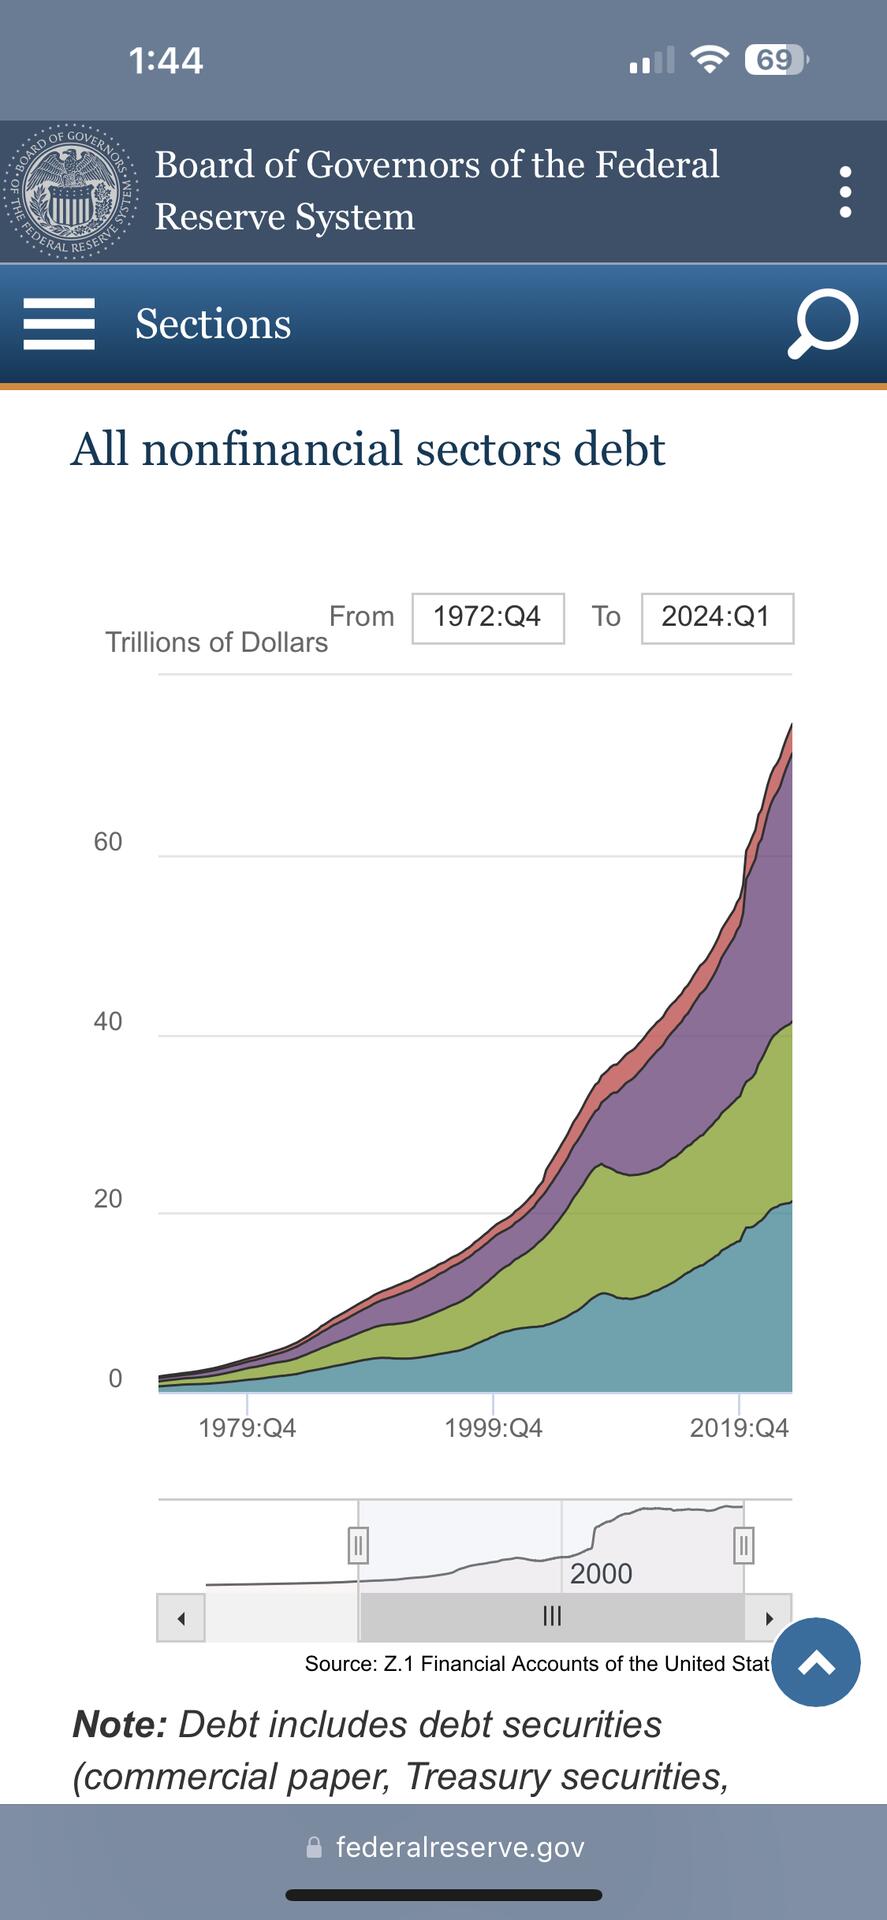
I took the CPI data from the Federal Reserve Bank of St. Louis and the BTC data from CoinDesk (free API keys).

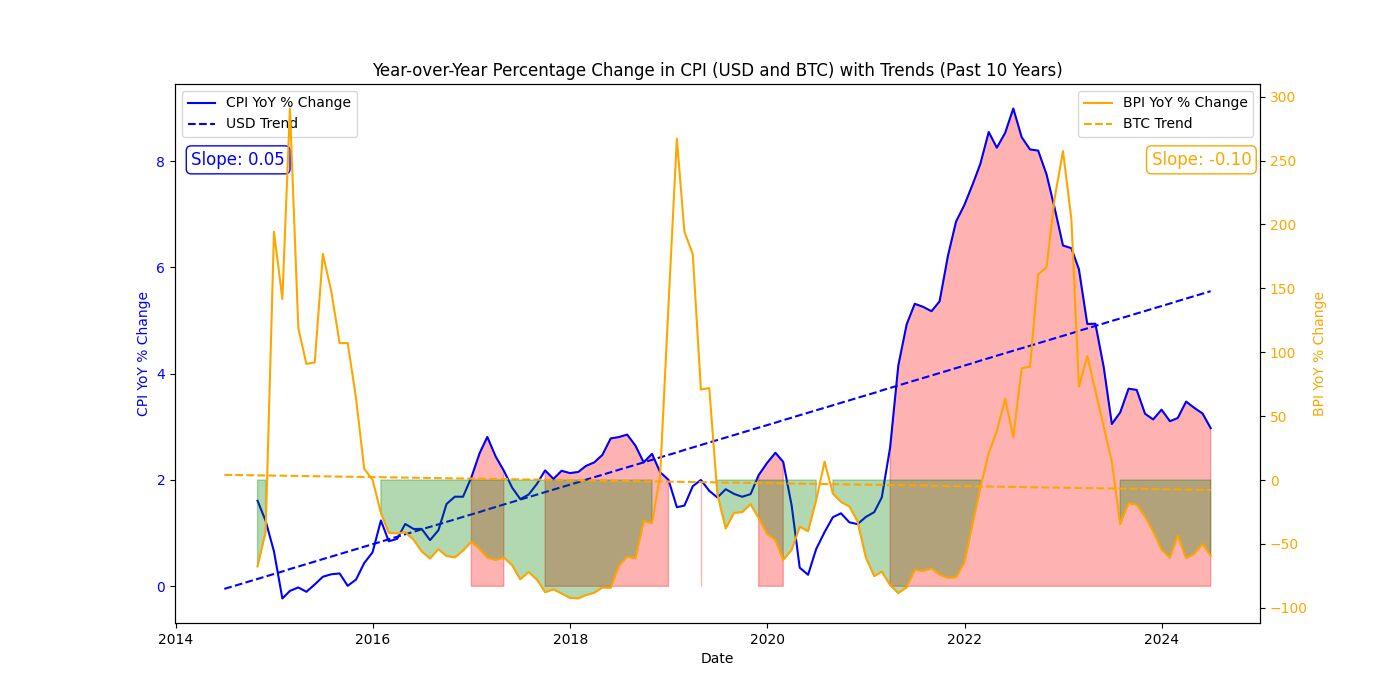
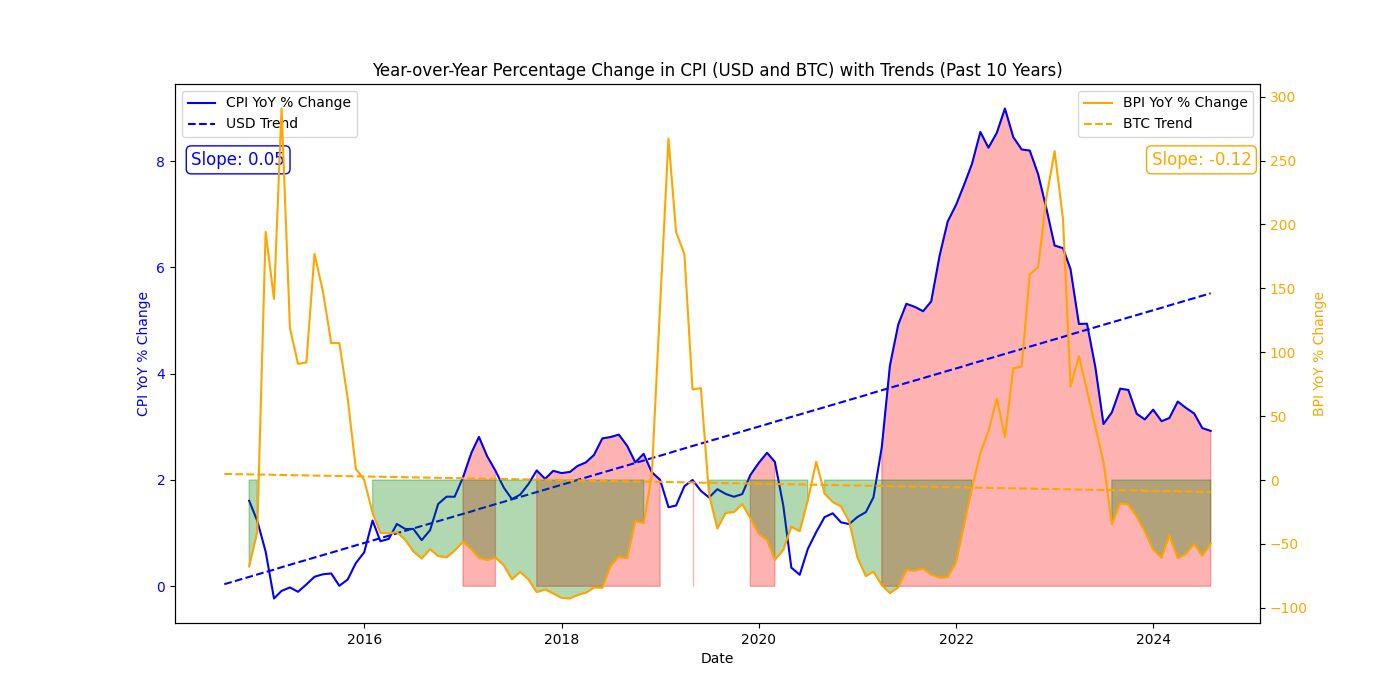
The chart below shows the past 10 years data, all that was available via API for free, in typical year-over-year fashion as well as trend lines.

Since the targeted inflation rate is 2%, I've shaded in red any time the CPI is over 2%. And since my base case is that BTC will gain purchasing power, I've shaded in green any time BPI is negative.

I'm still playing around with this, but I find it pretty interesting and different than most BTC charts I see floating around.

I figured I'd #AskNostr to get some feedback and hopefully some opinions on improved methods and/or data sources.

Based on the data thus far, the CPI trend is 0.05 and the BPI trend is -0.10, suggesting that prices are falling for bitcoiners twice as fast as they are rising in USD despite the large spikes during the bears.

I plan on following this each month when the CPI comes out, and modifying it to make improvements along the way. Should be neat to see how things go over the coming years.

#Bitcoin #Coding

Reply to this note

Please Login to reply.

Discussion

That's an interesting experiment. I'd be curious to see the relationship evolve over time. Nothing to add here, other than that.

Very cool thought experiment. I’d be curious to see this in conjunction with stacking methods: a lump purchase on day one, or DCA, or mining (large upfront dollar cost, ie could have spent a few thousand dollars on sats that day, but with “DCA at a discount” throughout bull markets)… stuff like that. Not sure how feasible as far as charts and stuff go, but something I wonder about occasionally.

Keep exploring! Seems like you’ve got a good brain - interested in what else you do with this 🤜🤛

Appreciate it! I've thought about some of that as well, but seems a bit tricky to set up for me at the moment. Perhaps something I'll take a crack at in the future!

Haha it’s tricky for me to even conceptualize so I don’t blame ya

Your thesis regarding what CPI is, is wrong. Like the name suggests, the CPI measures price increases (even though manipulated). Thus completely useless data. Price increases are the trickle down, delayed effects of inflation. Inflating the money supply that is. Which, in a debt based system is debt. Total debt, including federal, state and local, business and private debt. Currently $80 trillion in the US. The purchasing power of #Bitcoin imho is currently more of a function of adoption. Unfortunately the exchange rate vs the USD is also heavily manipulated ever since the Government/Wall Street got involved. And they are slushing it around between the USD/Futures and ETFs, Strategic Reserves, Corporations, seized Bitcoin etc.

I get that consumer price inflation is a result of monetary inflation mainly via debt. All I'm trying to find is the increase/decrease in cost of consumer goods priced in BTC. If CPI measures price increases, would CPI denominated in BTC not show that?

I also understand that CPI is heavily manipulated, and so is BTC market price data at this point, but what isn't in a fiat world? I like puzzles and this one has a hold of me at the moment.

Maybe create your own sample of goods and services?

Looks like I'm missing something, what's the mathematical relationship between CPI, BTC price, and BPI? Maybe this is obvious for economics people, but I'm a noob :⁠-⁠P

Pretty much BPI = CPI/BTC Price. I'm noob too, and definitely not an economics person, at least by profession.

My understanding is that although CPI doesn't have a unit, dividing it by the price of BTC works because it gives the amount of BTC needed to achieve the same purchasing power represented by the CPI.

Okay, thanks. This idea seems like a nice idea. Looking forward to see where this takes you :⁠-⁠) I'll also think on it a bit :⁠-⁠)

I'm playing around with my python too

Bitcoiner Price Index Update for August 2024

Year-over-year CPI change in USD: 2.59%

Year-over-year CPI change in BTC: -54.17%

nostr:nevent1qqsgexxff7r8frkn6l6guzjrq6ym7rv8zk5hu26ufjha39dvsg3uq7cpzemhxue69uhhqatjwpkx2un9d3shjtnrdakj7q3q4kxevcxxwhfm8gt0c9yycyp8s2agxu9wt72wch7zkfz23j9q5kysxpqqqqqqzwsaqxk